
March Asher Air Leak Effects
Table of Contents
Introduction
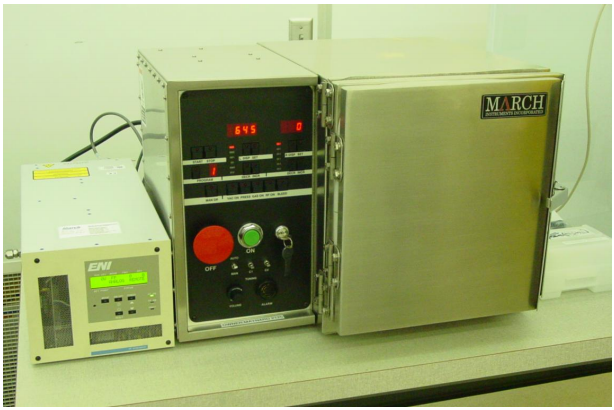
Over time, the March Asher1 developed some air leaks which degraded the purity of Oxygen in the normal photoresist ash process. At first, it was thought that the air leak was comparable to the process gas flow rate due to a missing parenthesis in the EXCEL data analysis, so an effort was made to examine the influence of air on the O2 etch rate of photoresist. Nevertheless, this paper contains some useful information on the “air” effect on etch rates of s1813 photoresist produced by a mixture of oxygen containing various proportions of air.
Experiment Description
The photoresist RIE etch process depends on several basic variables: RF power, pressure, etch-time, gas composition, and electrode configuration. This paper focuses on the gas composition, so all variables are held constant except gas composition and pressure. There are two mass flow meters in the March Asher. The Oxygen flow meter has a 100 sccm max, and the Argon flow meter has a 250 sccm max. In order to characterize the influence of air on the Oxygen ash rate, I opened the Ar meter input to air so a precise amount of air could be incorporated into the plasma. The power was set at a constant 50 Watts which is the normal level for a light ash process. The etch rate was measured by determining the photoresist thickness at 49 points on a 3 inch wafer using our nanospec optical film thickness tool. The process time was also set to a fixed 5 min so that a sufficient amount of resist would be removed at each experimental step to obtain reasonable film thickness accuracy. The key variable was the ratio of air to Oxygen. This was manipulated to maintain a constant pressure in one experiment and allowed to add pressure in another to simulate a true leak. The final experiments produced etch rates as a function of vacuum pressure for pure Oxygen and “pure” air for comparison. “Air” in this paper is defined by the “air” in the clean room which is controlled to the following specs: Temp = 70 +/- 1 F, Relative Humidity = 45 +/- 5 %. Chemical composition of our air is unknown in detail.
Experiment #1 – Air Leak
The deteriorated condition of the chamber vacuum seals was first measured by determining the leak-back rate of the chamber over time. This was accomplished by measuring the vacuum chamber pressure over time with all valves closed after pumping the chamber down to its lowest attainable pressure. This gives us a value on which to improve by finding and fixing the air leaks into the chamber. Figure 1 shows the leak rate in standard cubic centimeters per minute (sccm) for several conditions: 1) leak rate as originally found, 2) leak rate after changing the door seal and tightening the gas line fittings, and 3) leak rate after cleaning the chamber with a high power Oxygen plasma to reduce internal out-gassing as a contributor to the processing pressure. The cleanup process consisted of a 300 W O2 plasma at a pressure of 250 mTorr for 20 minutes.
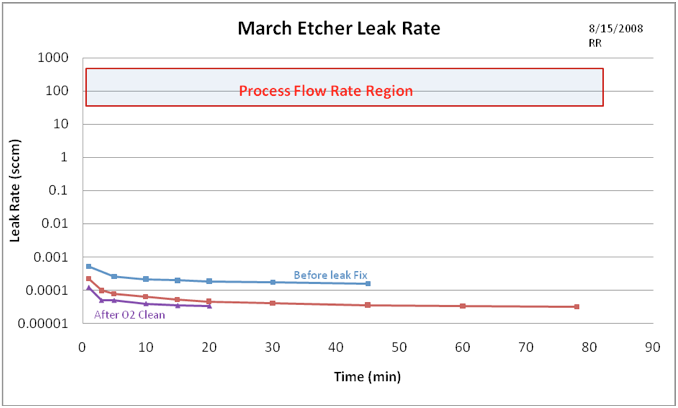
Figure 1. March Asher vacuum pressure as a function of time à leak rate. The top line shows the original leak rate, the middle line shows the improved leak after fixing the leaks, and the bottom line shows a reduced internal out-gassing rate after organic removal by a high power Oxygen etch. The shaded box represents the flow rate region used in actual etch processes – the original data analysis suggested that the air leak rate was comparable to the process gas flow and may have a significant impact on etch results, particularly on short etch processes, but in retrospect from the revised analysis above, the leaked-in air appears to be only a tiny component of the chemistry.
Experiment #2 – Raw Etch Effect
The second experiment is a simple inclusion of air into the O2 etch process by utilizing the second mass flow meter to add a measured flow of air into the process to determine the etch rate effect from the air. This provides a data set that simulates a leak into the process chamber with all the resulting effects. To accomplish this goal, a 3 inch diameter wafer was coated with Shipley 1813 photoresist and subjected to 5 minute etches at various flow rates of air. Data was taken on the remaining thickness of photoresist by the NanoSpec thickness measurement tool to show the etch rate as a function of air content in the plasma. This experiment is however convoluted because no control of the rising pressure due to the air content was maintained. This is what a user would obtain if no attention was paid to the pressure rise. Figure 2 shows the etch rate as a function of air content in the plasma along with the actual pressure in the plasma chamber. Since pressure is a strong player in the etch rate function, the resist etch rate drops more because the pressure is rising as more air is introduced, than the chemical effect that air may have on the oxygen etch rate.
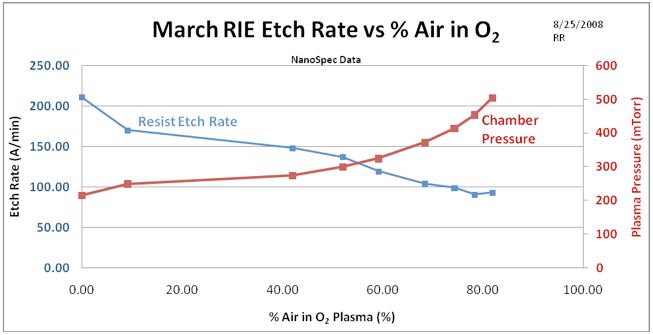
Figure 2. Photoresist etch rate as a function of air content of the plasma. Note that the etch rate decreases as a function of air content. However also note that the pressure is rising as more air is added to the process. The higher pressure also causes the etch rate to decrease because of diminishing molecular mean free paths and subsequent reduction of sheath voltage and thus reduction of surface bombardment by high energy ions.
Experiment #3 – Pure Etches
To gain further insight into the mixed experiment above, we followed up the experiment with a pure Oxygen and a “pure” air etch rate measurement. This experiment will show us the etch rates of both air and O2 as a function of chamber pressure. Figure 3 shows the combined pure etch rates as a function of pressure for O2 and air. Both gases show an enhanced etch rate at low pressures where ion bombardment aids the chemical etching. At higher pressures, air and O2 appear to have the same etch rate. This experiment basically calibrates the etch rates of Oxygen and air over the plasma pressure range.
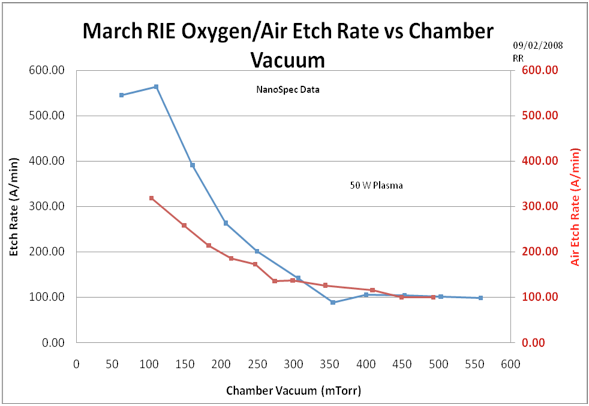
Figure 3. Comparison of pure air and pure O2 etch rates of S1813 photoresist with respect to chamber pressure. Pure O2 appears to achieve a higher bombardment etch enhancement than air at low pressures but at high pressures, the air and O2 etch rates converge to the same level. Note that the peak (bombardment enhanced) etch rate for O2 is about 100 mTorr.
Experiment #4 – Constant Pressure Etches
This experiment, varies the mix of air and O2, but maintains a constant pressure to reveal the effects of composition apart from pressure. This is done by adjusting the gas flows to achieve various gas compositions but maintain the same pressure. This experiment should reveal the chemical differences in the comparison of O2 and air etch rates. Figure 4 shows the results. There are two curves in this graph, one is the etch rate as a function of air mixed with O2, and the other shows the actual pressure in the reaction chamber for each etch rate data point. (Compare the pure air etch rate in Fig. 3 to that in Fig. 4).
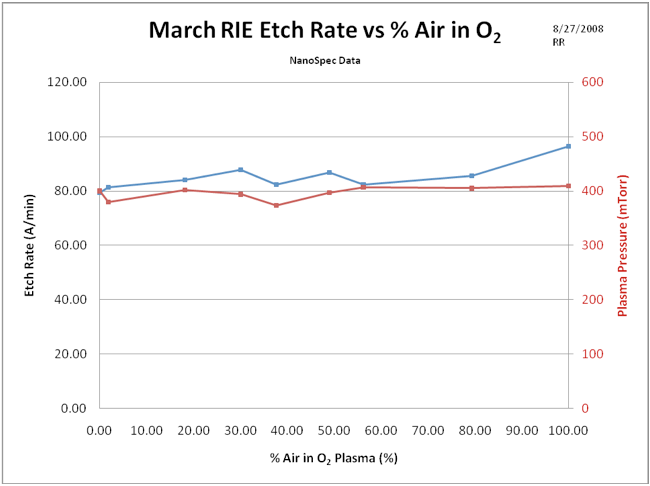
Figure 4. Constant pressure photoresist etch rate as a function of air to O2 ratio. Top curve represents the etch rate (left vertical axis) and the bottom curve reports the chamber pressure, (right vertical axis). The conclusion is that amazingly enough, the plasma composition does not change the etch rate appreciably over the entire range of compositions.
Conclusion
This paper has described the effects of an air leak into the O2 plasma chemistry and documented the effect on the etch rate using Shipley 1813 photoresist as an example etch medium. Also included in this paper are calibration data on the mass flow meters and a special calibration of air flow through the Ar mass flow meter. The independent etch rate of both air and O2 have also been measured.
The results of this study show that even an enormous air leak into the plasma does not affect the etch rate of the O2 plasma to a significant extent. At low (RIE) pressure, the air etch rate is about ½ that of O2, but as the
pressure rises, both O2 and air achieve the same etch rate on the S1813 photoresist.
Appendix A – Calibration
Chamber Pressure vs. Gas Flow Rate
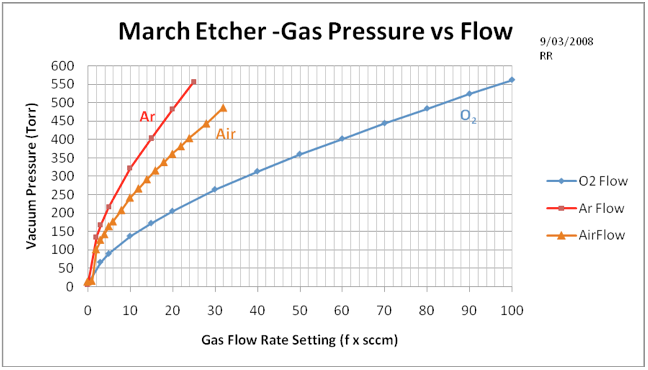
Figure A1. This chart shows the relation between the gas flow rate setting and the resulting vacuum pressure achieved in the reaction chamber. The Argon mass flow controller maximum flow is 250 sccm and the Oxygen meter is 100 sccm – air flow was obtained from the Ar flow meter. As time goes on, the base pump pressure may degrade and shift the lower end of this correlation curve somewhat.
Actual Flow Rate vs Flow Setting
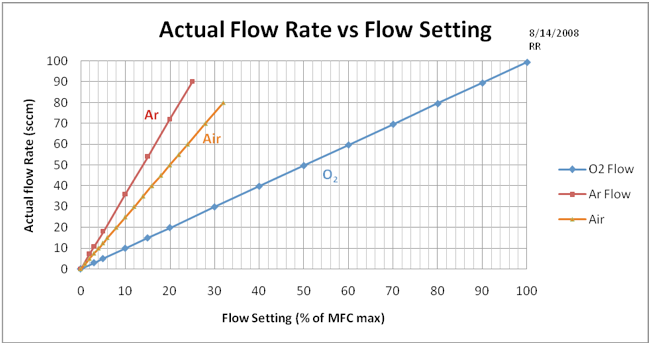
Figure A2. This chart calibrates the March Etcher gas flow setting to actual flow in units of Standard Cubic Centimeters per Minute (sccm). The Argon Mass Flow Controller maximum flow is 250 sccm, and the Oxygen MFC meter is 100 sccm – thus the large difference in pressure curves. Note that air flow was obtained from the Ar flow meter.
Appendix B – Raw Data
March Etcher Original Leak Rate (Fig. 1)
| dTime | P (Torr) | Atm | n (Moles) | Vstp
(cm3) |
Leak Rate sccm |
|
0 |
0.012 | 1.5789E-05 | 9.93954E-06 | 0.000293 |
0 |
|
1 |
0.021 | 2.7632E-05 | 1.73942E-05 | 0.000512 | 0.000512 |
|
5 |
0.053 | 6.9737E-05 | 4.38996E-05 | 0.001293 | 0.000259 |
| 10 | 0.089 | 0.00011711 | 7.37182E-05 | 0.002171 | 0.000217 |
| 15 | 0.122 | 0.00016053 | 0.000101052 | 0.002977 | 0.000198 |
| 20 | 0.154 | 0.00020263 | 0.000127557 | 0.003757 | 0.000188 |
| 30 | 0.212 | 0.00027895 | 0.000175599 | 0.005172 | 0.000172 |
| 45 | 0.293 | 0.00038553 | 0.00024269 | 0.007149 | 0.000159 |
March Etcher Leak Rate after Fix (Fig. 1)
|
March Etcher: Leak Rate after High Power O2 Cleanup (Fig. 1)
| dTime
(min) |
P (Torr) |
Atm |
n (Moles) | Vstp
(cm3) |
Leak Rate sccm |
|
0 |
0.005 | 6.57895E-06 | 4.14147E-06 | 0.000122 |
0 |
|
1 |
0.005 | 6.57895E-06 | 4.14147E-06 | 0.000122 | 0.000121988 |
|
3 |
0.006 | 7.89474E-06 | 4.96977E-06 | 0.0001464 | 4.87953E-05 |
|
5 |
0.01 | 1.31579E-05 | 8.28295E-06 | 0.000244 | 4.87953E-05 |
| 10 | 0.016 | 2.10526E-05 | 1.32527E-05 | 0.0003904 | 3.90362E-05 |
| 15 | 0.021 | 2.76316E-05 | 1.73942E-05 | 0.0005124 | 3.41567E-05 |
| 20 | 0.027 | 3.55263E-05 | 2.2364E-05 | 0.0006587 | 3.29368E-05 |
March Etcher RIE Etch Rate of s1813 Photoresist vs %Air in O2 (Fig. 2)
|
March RIE Oxygen Etch Rate vs Chamber Vacuum (Fig. 3)
|
Step # |
Power (W) |
Etch Time (min) | O2
Set (%) |
Air Set (%) | O2 Flo
(sccm) |
Air Flo
(sccm) |
P (mTorr) |
Avg Tk (A) |
Tk Sigma (A) |
% Air Flow |
Etch Rate (A/min) |
P (mTorr) |
|
Ref #1 |
14210 |
32 |
||||||||||
|
Ref #2 |
0 |
13513 | 144 | |||||||||
|
1 |
50 |
5 |
2 |
0 |
1.988 |
0 |
62 |
11485 | 239 | 0.00 | 545.00 |
62 |
|
2 |
50 |
5 |
6 |
0 |
5.964 |
0 |
110 | 8669 | 484 | 0.00 | 563.20 | 110 |
|
3 |
50 |
5 |
12 |
0 |
11.928 |
0 |
160 | 6717 | 664 | 0.00 | 390.40 | 160 |
|
4 |
50 |
5 |
19 |
0 |
18.886 |
0 |
206 | 5403 | 824 | 0.00 | 262.80 | 206 |
|
5 |
50 |
5 |
27 |
0 |
26.838 |
0 |
249 | 4397 | 951 | 0.00 | 201.20 | 249 |
|
6 |
50 |
5 |
37 |
0 |
36.778 |
0 |
306 | 3690 | 1030 | 0.00 | 141.40 | 306 |
|
7 |
50 |
5 |
47 |
0 |
46.718 |
0 |
354 | 13072 | 183 | 0.00 | 88.20 | 354 |
|
8 |
50 |
5 |
58 |
0 |
57.652 |
0 |
400 | 12545 | 211 | 0.00 | 105.40 | 400 |
|
9 |
50 |
5 |
70 |
0 |
69.58 |
0 |
453 | 12029 | 235 | 0.00 | 103.20 | 453 |
|
10 |
50 |
5 |
83 |
0 |
82.502 |
0 |
503 | 11527 | 252 | 0.00 | 100.40 | 503 |
|
50 |
5 |
97 |
0 |
96.418 |
0 |
558 | 11038 | 271 | 0.00 | 97.80 | 558 |
March RIE Air Etch Rate vs Chamber Vacuum (Fig. 3)
|
Step # |
Power (W) |
Etch Time (min) | O2
Set (%) |
Air Set (%) | O2 Flo
(sccm) |
Air Flo
(sccm) |
Est P (mTorr) |
Avg Tk (A) |
Tk Sigma (A) |
% Air Flow |
Etch Rate (A/min) |
Actual P (mTorr) |
|
Ref #1 |
14303 |
22 |
||||||||||
|
Ref #2 |
0 |
|||||||||||
|
1 |
50 |
5 |
0 |
2 |
0 |
7 |
93 |
12714 | 204 | 100 | 318 | 104 |
|
2 |
50 |
5 |
0 |
4 |
0 |
14 |
140 | 11421 | 330 | 100 | 259 | 149 |
|
3 |
50 |
5 |
0 |
6 |
0 |
22 |
178 | 10352 | 420 | 100 | 214 | 183 |
|
4 |
50 |
5 |
0 |
8 |
0 |
29 |
212 | 9427 | 490 | 100 | 185 | 214 |
|
5 |
50 |
5 |
0 |
10 |
0 |
36 |
242 | 8565 | 700 | 100 | 172 | 247 |
|
6 |
50 |
5 |
0 |
12 |
0 |
43 |
269 | 7887 | 575 | 100 | 136 | 274 |
|
7 |
50 |
5 |
0 |
14 |
0 |
50 |
295 | 7203 | 606 | 100 | 137 | 299 |
|
8 |
50 |
5 |
0 |
18 |
0 |
65 |
343 | 6571 | 650 | 100 | 126 | 344 |
|
9 |
50 |
5 |
0 |
24 |
0 |
86 |
406 | 5994 | 677 | 100 | 115 | 409 |
|
10 |
50 |
5 |
0 |
28 |
0 |
101 | 445 | 5492 | 689 | 100 | 100 | 449 |
|
50 |
5 |
0 |
32 |
0 |
115 | 482 | 4991 | 715 | 100 | 100 | 493 |
March RIE Etch Rate vs %Air in O2 at Constant Pressure (Fig. 4)
|
Etch Chamber Pressure vs. Gas Flow Rate Setting (Fig. A1 & A2)
O2 Corr Factor 0.994
|
|||||||||||||||||||||||||||||||||||||||||||||||||||||||||||||||||||||||||||||||||||||||||||
Ar corr Factor 1.44
|
|||||||||||||||||||||||||||||||||||||||||||||||||||||||||||||||||||||||||||||||||||||||||||